
Digital 2026: 2 in 3 people on Earth now use social media
We revealed a wealth of big headlines and digital milestones in our Digital 2026 Reports, but one of the standout findings is that more than 2 in 3 people on Earth now use social media.
Kepios’s analysis of the latest data published by the top social media platforms indicates that there are now 5.66 billion active “social media user identities” at a worldwide level, which equates to 68.7 percent of the total global population.
And while it’s important to stress that our social media user identities figure may not represent unique human individuals – as we’ll explain below – this data indicates that social media users have now reached “supermajority” status, with twice as many people using social media as not.
Understanding our social media user identities figure
For context, Kepios uses the potential advertising reach figure for the individual platform with the greatest ad reach in each country as the basis for its social media user identities figures.
This approach reduces the potential for double-counting people who use more than one platform each month, which is particularly important when we consider that GWI’s data shows the vast majority of adult social media users make use of two or more social media platforms each month.
But despite Kepios’s conservative, “single-platform” approach, it’s important to note that the top social platforms all acknowledge that their potential reach figures may include some degree of duplicate and “false” accounts, and this may inflate ad reach figures (as compared with unique, human users).
And there may be some evidence of this in our user identities data too, with potential adult reach figures exceeding the total adult population in a number of different countries.
However, in addition to duplicate and false accounts, issues such as user age misstatements may also play an important role here.
For example, our analysis suggests that there are a meaningful number of real humans below the age of 18 who “misrepresent” their real age on social platforms, in order to access age-restricted content.
Meanwhile, differences between countries’ “official” census counts and their actual resident populations can also lead to significant anomalies when comparing audience reach with population, and this issue may be particularly prevalent in the Arabian Gulf.
For example, government data suggests that more than 4 in 10 people living in Saudi Arabia are “non-Saudi”, while expats may account for almost 90 percent of the UAE’s total residents.
So, while data for specific age groups and geographies may sometimes appear distorted, such anomalies do not necessarily imply that social media user numbers are “incorrect”, or that they have been artificially inflated by “non-human” identities.
And for added perspective, GWI’s data indicates that none of the ad-supported social platforms reach 100 percent of social media users in any given country.
As a result, the potential for user duplication in platforms’ ad reach data is somewhat mitigated by the undercounting that results from only including reach data for the single largest platform in each country.
For perspective, Kepios’s analysis indicates that its social media user identities figure equates to 93.8 percent of all the world’s internet users (regardless of age), whereas GWI’s survey data indicates that 96.9 percent of internet users aged 16 and above use at least one social platform each month.
So, while it’s important to acknowledge the caveats detailed above, we’re confident that our social media user identities figure is reliably representative of actual human individuals.
Social media still showing impressive growth
Meanwhile, despite enduring headlines proclaiming the “death” of social media – even in reputable media – the evidence clearly points to continued growth in social media use.
Indeed, on a year-on-year basis, our research indicates that social media user identities have increased by 259 million since October 2024, resulting in worldwide annual growth of 4.8 percent.
For reference, regular Global Digital Reports readers may notice that our latest social media user identities figure is significantly higher than the total we reported just a few weeks ago, in our Digital 2025 July Global Statshot Report.
However, this apparent “jump” is largely due to revisions in internet user numbers for China, which we use in our calculations for social media user identities in the country [note: our analysis suggests that CNNIC’s data is more representative of social media use in China than active user numbers for individual social platforms].
Fortunately, we’ve been able to “rebase” some of our historical Chinese social media user numbers, so the current figures you’ll see for annual growth in social media user identities in our Digital 2026 Reports are still an accurate representation of actual, year-on-year growth.
Please note that we’ve been unable to rebase our social media user data prior to July 2024 though, so any figures for growth that span periods including July 2024 will be “inflated” by revisions in the source data, and such changes will not be representative of actual changes in social media use.
Regardless of when we “account” for these data revisions, however, the net outcome remains the same: there are 5.66 billion active social media user identities around the world in October 2025.
Social media use doubles in a decade
And that’s a fairly remarkable figure when we consider that the first “modern” social network – Friendster – only launched in March 2003.
Social media platforms existed before Friendster of course, and if you’d like to explore a more detailed “history” of social media use around the world, you might find this detailed timeline from our Digital 2024 reports useful.
However, Friendster was the first “social network” to gain mainstream momentum, so it’s often helpful to benchmark overall social media growth against that platform’s launch.

But perhaps even more remarkable is the fact that social media users have more than doubled over the past decade.
Kepios analysis indicates that social media user identities stood at just under 2.27 billion in October 2015, when the global “adoption” rate was equal to 30.3 percent.
Since then, our global social media user total has increased by close to 3.4 billion users, resulting in an average of more than 28 million new users every month, or almost 1 million new users per day.

However, more recent figures suggest that current monthly growth is somewhat lower.
For example, the latest quarter-on-quarter figures put average monthly growth at 20.5 million, while the annual growth figure puts the average closer to 21.5 million new user identities per month.
But having said that, while it’s important to acknowledge a slowdown in growth, social media user numbers continue to grow at an impressive rate.

Moreover, the latest research from GWI shows that social media ads are still internet users’ third most important source of brand awareness after search engines and TV ads, with more than 30 percent of adult internet users saying that they discover new brands, products, and services via ads on social platforms.
So, just in case you’re wondering whether social media should still have a place in your brand’s marketing mix in 2026, the available data seem to present a compelling case for its continued inclusion.
Social media platform preferences
But which platforms should marketers prioritise in 2026?
To answer that question, we need to dig deeper into the data.
For initial context, the latest research from GWI reveals that online adults now use an average of 6.75 different social media platforms each month.
The company’s Q2 2025 figure is down slightly compared with the recent high of 6.86 platforms that we saw in its Q4 2024 wave of research, but the current figure broadly matches the averages for Q2 2024 and Q2 2023, so those more recent declines may simply be the result of regular, seasonal patterns.
It’s also worth highlighting that platform use varies meaningfully by age, with internet users aged 16 to 24 using more than twice as many platforms as online retirees.
However, the typical internet user aged between 55 and 64 still uses an average of more than 5 platforms per month, while users aged 65 and above use an average of more than 3½ platforms each, so marketers should still optimise for a “portfolio” of platforms, even when it comes to older demographics.
But while trends by age appear to follow stereotypes, the gender data delivers something of a surprise.
For reference, GWI’s research finds that – overall – women are more likely to use social media than men.
More specifically, the company’s latest wave of research finds that 97.3 percent of female internet users aged 16 and above use at least one social platform each month, whereas the figure for males in the same age group is slightly lower, at 96.6 percent.
However, GWI’s figures for average platforms used tell a different story.
The latest data indicates that adult males use an average of 6.81 platforms each month, compared with an average of 6.73 for adult females.
And the key takeaway here is not to fall into the trap of following assumptions and stereotypes, because data often reveals behaviours that we might not expect.
The world’s top social platforms
Meanwhile, research shows that the mix of platforms in people’s “social media repertoires” continues to evolve.
But which platform comes out top of the rankings?
Well, as we’ve seen so many times over the past 14 years of producing these Global Digital Reports, the answer to that question is “it depends”.
I’m guessing you’re looking for a more definitive answer though, so let’s explore data for some of the most important metrics.
The world’s most used social platforms
User figures remain an important consideration when evaluating social media platforms, even if such data remain something of a “blunt instrument”.
But despite their apparent simplicity, even user numbers don’t offer a clear and conclusive “winner”.
For starters, some of the top platforms don’t publish regularly updated active user numbers, with Facebook and YouTube being two prime examples.
Moreover, different platforms prioritise different metrics, with some preferring daily active users, some prioritising monthly active users, and others offering more convoluted data points that appear to be designed specifically to prevent direct comparison with their peers.
We’ve collated the latest figures for a range of large platforms in the chart below, but it’s important to highlight that the data we’ll explore below is probably more representative when it comes to comparing platforms.
Fortunately, there are two data sources that enable us to compare platforms on a like-for-like basis: GWI’s survey-based research, and Similarweb’s consensual app tracking data.
It’s worth noting that GWI’s research only covers 54 of the world’s largest economies, but these countries and territories account for roughly 81.6 percent of the world’s total connected population.
As a result, the company’s data is broadly representative of global behaviours, even if it may underrepresent activity in some of the world’s less developed economies.
Top social platform by self-declared use
And at a worldwide level, GWI’s data suggests that Facebook currently has the largest audience of online adults aged 16 and above, with 56.9 percent of respondents in the Q2 2025 survey saying that they used the platform at least once within the previous 30 days.
However, YouTube is not included in the same part of GWI’s survey as all the other platforms, because GWI treats YouTube as a video platform rather than as a social platform.
As a result, figures for YouTube may not be directly comparable with those for other platforms in this ranking.
And given that 55.4 percent of GWI’s respondents say that they use YouTube each month – just 1.5 percent points lower than Facebook – there’s a possibility that YouTube might actually rank higher than Facebook were the video platform to appear within the same list of answer options in GWI’s survey.
Next up, Instagram ranks third in GWI’s survey data, with 55.1 percent of online adults saying that they used the platform within the past month.
Meta stablemate WhatsApp ranks fourth with 54 percent, while Messenger ranks fifth, at 38.4 percent.
For reference, TikTok ranks sixth with 36 percent, but it’s important to highlight that we’ve removed the data for China from GWI’s global TikTok figure, because the “TikTok” option in GWI’s survey in China actually references “Douyin”, which Bytedance operates as a separate platform to TikTok.
And the rest of this ranking also makes for interesting reading, especially with regards to the growing popularity of Pinterest, and the enduring appeal of X (the platform formerly known as Twitter).

Demographic differences
However, this overall ranking can be deceptive, because adoption rates vary meaningfully by age.
For example, GWI’s data indicates that users aged 65 and above are the most likely to use Facebook, although – contrary to stereotypes – the platform appears to be consistently popular across all other age groups.
Meanwhile, Pinterest is significantly more popular amongst female internet users aged 16 to 24 than it is amongst any other demographic, which may make the pinboard platform a particularly appealing option for brands hoping to reach and engage younger women
Conversely, the biggest numbers in Reddit’s audience profile align with male users aged 16 to 34, suggesting that the community platform may be a compelling choice for brands hoping to reach and engage younger men.
Most used social media apps
But if we turn our attention to the social media apps that people actually open on their mobile handsets, a somewhat different story emerges.
For reference, this data comes from Similarweb’s App Intelligence dataset, which relies on the consensual tracking of millions of smartphone handsets around the world.
As with all research though, there may be some degree of “respondent bias” in this data, in the sense that the kinds of people who are willing to allow a company to track their smartphone activity may not necessarily be wholly representative of society as a whole.
However, given the sheer size of Similarweb’s App Intelligence panel, we’re confident that the findings in this data are both representative and reliable.
This dataset doesn’t include users in China though, so China-specific platforms won’t appear in this ranking.
And in contrast to the GWI rankings that we saw above, Similarweb’s data indicates that YouTube is the clear leader when it comes to active users of the world’s top social media apps.
Note that the figures on this chart represent indices, which compare the active user numbers of each platform with the active user number of the top-ranked platform (and as a result, the top platform will always have an index value of 100).
WhatsApp ranks second with an index of 86.5, but this figure indicates that YouTube’s active app user base is more than 15 percent larger than that of its next nearest rival.
Instagram places third in our Similarweb social app ranking with an index score of 79.9, while Facebook only ranks fourth, with a score of 77.1.
TikTok places fifth in this ranking by worldwide active users of platforms’ mobile apps, but it’s worth highlighting that Similarweb’s data indicates that YouTube has almost 50 percent more monthly active app users than TikTok does.
And it’s also interesting to note that Snapchat performs markedly better in this dataset than it does in GWI’s survey, with Similarweb’s app tracking data placing Snapchat ahead of Telegram, Pinterest, and X.
The world’s favourite social media platform
As we noted above though, user numbers alone can be something of a blunt instrument when evaluating social media platforms, so let’s turn our attention to a different kind of metric: user sentiment.
GWI’s survey includes a question that asks respondents to identify their “favourite” social media platform, and this dataset provides yet another different perspective on the “top” platforms.
However, before we begin our analysis, please note that YouTube doesn’t appear as an answer option for this question in GWI’s survey, so it won’t appear in these rankings.
At a worldwide level, social media users aged 16 and above are most likely to identify WhatsApp as their “favourite” social media platform, with 17.4 percent of respondents – 1 in 6 – identifying Meta’s largest messaging platform as their preferred option.
Instagram ranks second with 16.4 percent of the vote, while Facebook completes Meta’s dominance of the top three spots, with 13 percent of respondents selecting this option.
Interestingly, WeChat ranks fourth, but it’s important to stress that a whopping 99 percent of the respondents who selected this option live in China, so it’s perhaps more representative to say that 微信 – or “Weixin”, as the platform is known in China – ranks fourth.
And TikTok rounds out the top five, with 9.1 percent of global respondents identifying the short video platform as their favourite social medium.
For added perspective, 1 in 3 adult social media users chose one of the top two options (i.e. WhatsApp or Instagram), while the top five platforms account for more than two-thirds of the total vote (67.3 percent).
However, it’s interesting to note that platform preferences vary meaningfully by age.
For example, Instagram is the clear favourite amongst social media users between the ages of 16 and 34, and WhatsApp only tops the charts once users pass the age of 35.
It’s also interesting to note that women are significantly more likely to select TikTok as their favourite platform than men are, while – perhaps surprisingly – men are more likely than women to identify Facebook as their favourite platform.
People use social media on most days
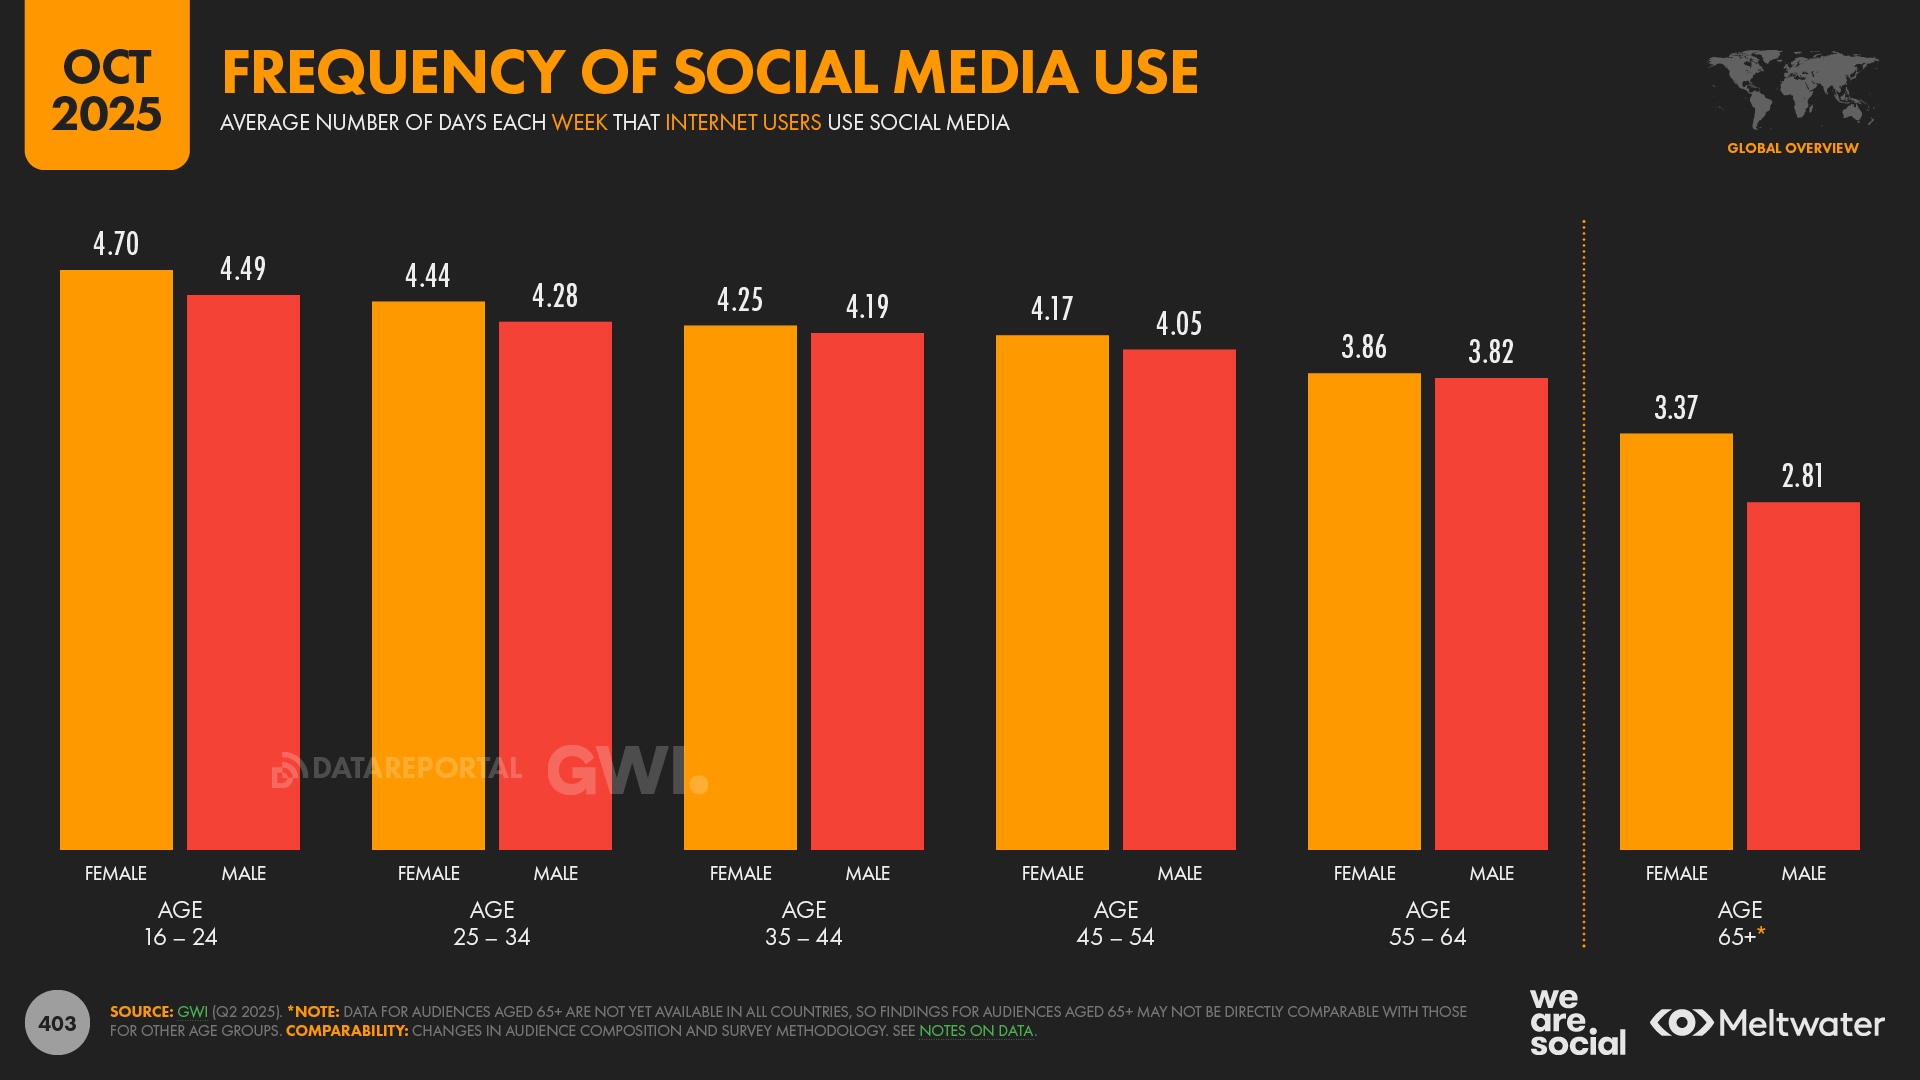
Most of the world’s connected adults use social media at least once every two days, with GWI’s latest research showing that – on average – online adults use social media on 4.21 days each week.
Moreover, GWI’s research indicates that people in just five of the world’s larger economies – France, Germany, Czechia, South Korea, and Japan – use social media less than once every two days.
In contrast, people in 11 countries out of the 54 covered by GWI’s survey indicate that they use social media on at least 5 days each week, with Nigerians saying that they use social media on 5.84 days out of every 7.
As stereotypes might lead us to expect, younger people are the most frequent users of social media, with respondents aged 16 to 24 telling GWI that they use social media on an average of 4.6 days each week.
Conversely, retirees exhibit the lowest frequency of social media use, with men aged 65 and above saying that they use social media on an average of just 2.81 days per week.
However, all other age groups see averages above 3.5 days per week, indicating that – on average – internet users below the age of 65 tend to use social media at least once every two days.
Feeding time
Meanwhile, GWI’s data also indicates that online adults spend an average of more than 1 hour per day browsing social networks like Facebook and X.
Moreover, if we add video-centric platforms like YouTube and TikTok into this mix, daily average consumption jumps to well over 2½ hours per day, resulting in a weekly average of 18 hours and 36 minutes per user.
And what’s more, amongst younger users, average social media consumption is even higher.
GWI’s data indicates that women aged 16 to 24 spend an average of 25 hours and 45 minutes per week scrolling social and video feeds, which equates to an average of more than 3 hours and 40 minutes each day.
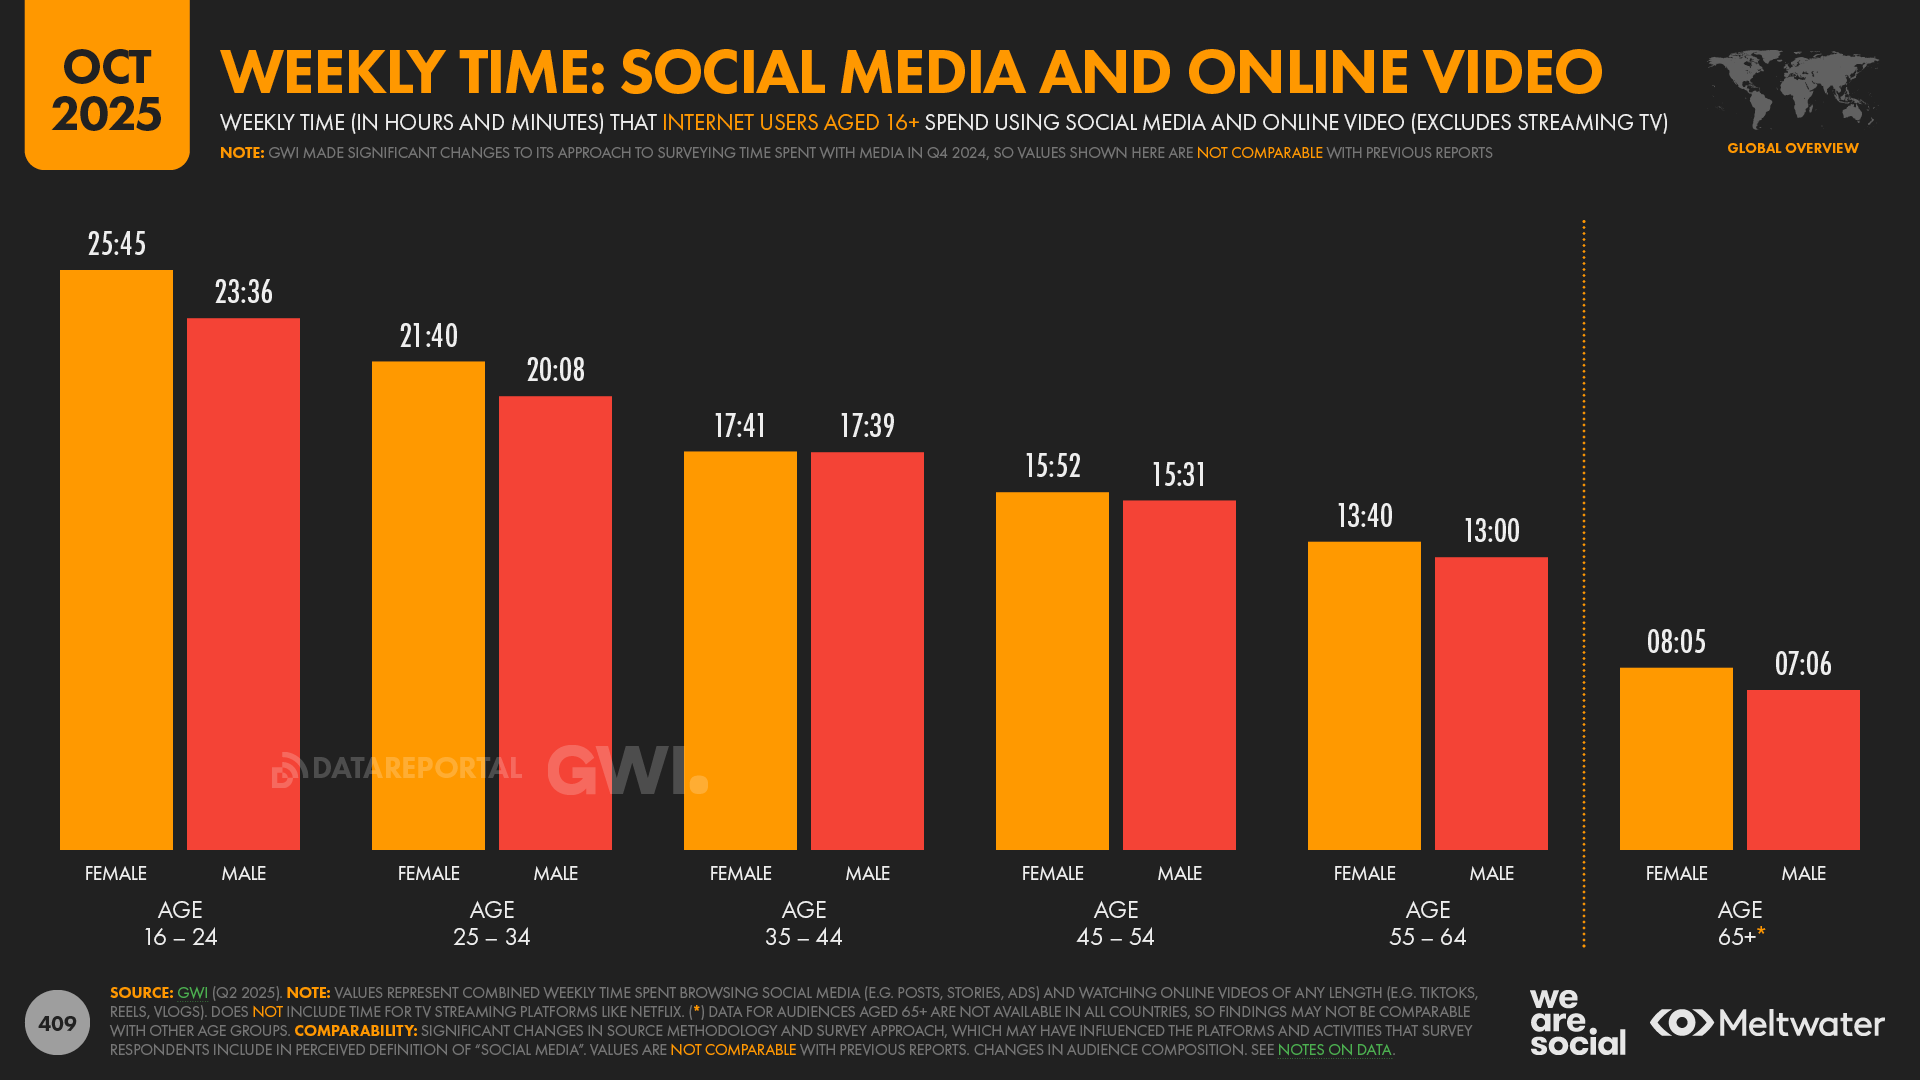
However, even retirees spend a meaningful amount of time scrolling social and video feeds, with the latest research indicating that male internet users over the age of 65 still spend an average of more than an hour each day engaging in these activities.
For perspective, if the typical adult in the world’s largest economies sleeps for between 7 and 8 hours per night, these figures suggest that – on average – women aged 16 to 24 spend roughly 22 percent of their waking lives scrolling feeds.
But even that global average of 18 hours and 36 minutes per week equates to a sizeable chunk of our lives, with the typical online adult now spending roughly 16 percent of their waking hours scrolling social and video feeds.
And to put these figures into broader perspective, our analysis of the latest GWI data indicates that the typical online adult now spends roughly 33½ hours per week consuming all types of online media (including streaming TV), which suggests that social and video feeds now account for more than half of our connected activities.
And just in case you’re wondering, that overall figure suggests that internet users now spend roughly 29 percent of their waking lives consuming online media.
Social media time per platform
As we saw earlier, however, social media platforms aren’t all created equal.
So which specific platforms claim the greatest share of the world’s social media activities?
Well, if we add up all the time spent by each app’s Android users in August 2025, Similarweb’s App Intelligence data reveals a clear “winner”, with YouTube accounting for well over 50 percent more total time than its next nearest rival, WhatsApp.
Facebook places third in this ranking, but Similarweb’s data suggests that Facebook users spend just 62.3 percent of the time using the platform’s Android app that YouTube’s users spend using YouTube’s Android app.
Instagram ranks fourth with an index score of 56.0, and TikTok rounds out the top five, with an index of 55.1.
And just for perspective, these figures suggest that – added up across each app’s active Android user base – YouTube accounted for almost twice as much total time as TikTok did in August 2025.
Share of total time drops sharply beyond the top five though, with sixth-placed Telegram accounting for barely one-tenth of the total time that app users spend using YouTube.
Average time per user
The ranking we saw in the previous section was based on the cumulative time spent by all of an app’s users, but the rankings look a little different for the average time spent by each individual user.
Indeed, Similarweb’s App Intelligence data shows that the typical TikTok user spends 1 hour and 37 minutes per day using the platform’s Android app, which is roughly 14 percent longer than the typical YouTube user spends using the YouTube Android app.
Instagram ranks third, with users spending an average of 1 hour and 13 minutes per day using the platform’s Android app, while fourth-ranked Facebook is the last of the top platforms to capture an average of more than one hour per day (67 minutes).
WhatsApp ranks fifth, with the messaging platform’s users spending an average of 59 minutes per day using the WhatsApp Android app.
Daily sessions
However, it’s interesting to note here that WhatsApp sees by far the greatest number of daily sessions amongst these top social apps.
More specifically, Similarweb’s data indicates that the typical WhatsApp Android user opens the platform’s app more than 20 times per day, which is almost 70 percent more frequently than second-ranked Instagram.
Meanwhile, TikTok enjoys the third-highest figure for daily sessions, with users opening the platform’s Android app an average of 10 times per day.
The average for YouTube is considerably lower though, with Similarweb’s data indicating that the typical YouTube user opens the platform’s Android app just 5.9 times per day.
Longest social sessions
And the quirks across these different metrics mean that YouTube actually enjoys the longest average session time amongst these top social apps.
Similarweb’s data indicates that each individual YouTube Android app session lasted an average of 14 minutes and 29 seconds in August 2025, which was roughly 50 percent longer than the duration of the typical TikTok session, which lasted 9 minutes and 42 seconds.
Facebook enjoys the third-longest average session time at 7 minutes and 17 seconds, while video-centric chat app Imo ranks fourth, with an average session length of 6 minutes and 52 seconds.
Instagram only places fifth in this particular ranking though, with the platform’s Android users averaging 5 minutes and 56 seconds per session.
Changing social media expectations
Considering that the world spends so much time using social media – and that we use such a wide variety of different platforms – it’s perhaps unsurprising to learn that people are turning to social media platforms for an ever greater range of activities.
Indeed, the latest research from GWI shows that social media users cite an average of 4.69 distinct reasons for using social platforms.
That average has continued to edge up over the past two years, indicating that people expect an ever greater array of “benefits” from their social media time.
Globally, “keeping in touch with friends and family” remains the top motivation for accessing social platforms, with more than half (50.2 percent) of adult social media users around the world citing this as a primary reason for using social media.
However, it’s interesting to note that “filling spare time” ranks second (39.7 percent), which may help to explain the continuing rise in popularity of video-centric platforms like YouTube and TikTok.
Just as an aside here, it can be easy to conflate “filling spare time” with “wasting time”, but in many cases, “filling spare time” might equate to making better use of otherwise “dead” time.
For example, in many parts of the world, people spend a significant amount of time each day on public transport, and social media feeds can offer a welcome distraction from the tedium of an arduous commute.
Meanwhile, “reading news stories” continues to rank third amongst top motivations for using social media, with more than 1 in 3 active social media users (35.4 percent) citing this as a primary social media activity.
Using social media for news is considerably more popular in some parts of the world though, with more than two-thirds of Moroccan social media users saying that reading news stories is one of their top motivations for using social platforms.
And it’s also interesting to note that the relative importance of news increases with age.
GWI’s data indicates that “reading news” stories ranks just fifth amongst the primary social media motivations of users aged 16 to 24, but it ranks second for all age groups over the age of 45.
Having said that thought, it’s worth highlighting that “keeping in touch with friends and family” takes the top spot across all age groups in GWI’s survey.
100 trillion #fyp views
Looking deeper into the numbers, our Digital 2026 Reports also offer some fascinating insights into how people use and engage with various platforms.
For example, TikTok’s own data suggests that TikToks tagged with #fyp have now been viewed more than 100 trillion times.
And yes, that really was trillion, with a “t”.
To put that figure in perspective, even if each of those views only lasted for one second, the combined time spent watching TikToks tagged with #fyp would equate to an eye-watering 3.2 million years.
But perhaps the most remarkable finding with this particular dataset is that TikToks tagged with #fyp attracted more than 20 trillion views in just the past eight months (mid-January to mid-September 2025), for an average of more than 82 billion views every single day.
For further perspective, TikTok’s tools also indicate that there are currently 7.7 billion TikToks available on the platform that have been tagged with #fyp, which means that each of those videos has attracted an average of roughly 13,000 views.
Not just for you
But #fyp isn’t the only TikTok hashtag to have delivered some astonishing viewcounts.
Kepios analysis indicates that TikToks tagged with #foryou have already racked up more than 50 trillion combined views, while a further seven hashtags have viewcounts exceeding 10 trillion.
It’s worth highlighting that a user might tag the same TikTok with multiple hashtags, so there’s bound to be some overlap in these figures.
Even then though, current trends indicate that it won’t be long before we need to start thinking of viewcounts in the quadrillions.
Despite the popularity of these tags, however, there’s no hard data to support the idea that their use actually increases the odds that a video will gain any greater momentum compared with TikToks that don’t include any of these top tags.
Indeed, “going viral” on TikTok seems to depend more on alchemy than robust science, which may help to explain why “meaningless” tags like #xyzbca have gained such popularity.
And in fact, TikTok’s users almost seem to have embraced the frustrating randomness of the platform’s algorithm, with the continued popularity of #fyppppppppppppppppppppppp [yes, really] perhaps the most expressive demonstration of users’ combined senses of hope and exasperation.
But it’s also worth highlighting that #fyp isn’t the most widely used hashtag on TikTok, with that honour going to #capcut.
And although the CapCut app is also owned by TikTok’s parent company, Bytedance, the ubiquity of the #capcut hashtag still serves to demonstrate the sheer scale of the “augmented world” that has grown up around TikTok and its global audience.
Planning a more strategic social marketing mix
So how can marketers use this wealth of social media data to inform a more “strategic” approach to social media marketing?
Well, one of the key things to remember is that most social media users make use of multiple social platforms each month, with the typical online adult averaging 6.75 platforms per month.
So, if marketers are to adopt the most strategic approach to social media, it might make sense for them to harness similar “diversity” in their platform plans too.
Fewer, bigger, better
That doesn’t mean you need to be on all platforms all the time of course, and in fact the latest data suggests that using more than four or five platforms at the same time is likely hugely inefficient.
More specifically, our analysis of research from GWI indicates that at least 98.8 percent of the users of any given platform use at least one other social platform in any given month.
One of the key takeaways from this data is that – in general – the larger a social media platform’s user base, the larger its unique audience.
However, even then, the largest platforms still see significant levels of overlap.
For example, 75.7 percent of YouTube’s monthly active adults told GWI that they also use Facebook each month.
Similarly, 74 percent of active WhatsApp users also use YouTube each month.
Indeed, across all of the top social platforms outside of China, each platform’s largest overlap is always in excess of 70 percent.
In other words, if you target audiences across just the two largest platforms, you’ll still end up with at least 70 percent duplication across the two.
Because of this, marketers will struggle to deliver any meaningful increase in potential social media reach once their mix includes the top two or three platforms by audience size.
And as a result, my recommendation would be to pick the top two platforms by size to ensure good reach, but then to use other criteria – i.e. factors other than reach – to identify any potential additions to your social platform mix.
Of course, the criteria that make the most sense for your needs will depend on your brand’s offerings, your current marketing objectives, and your specific audience’s social media behaviours.
However, here are a few “non-reach” metrics that may help you to identify strategically advantageous opportunities.
Social media platform frequency
Returning to our app tracking insights, Similarweb’s latest data indicates that WhatsApp enjoys the highest frequency of use amongst the world’s most used social media apps, with 85.1 percent of the platform’s Android users opening the app on a daily basis.
Facebook ranks second, with more than two-thirds (67.4 percent) of the platform’s Android users opening the app each day.
And Instagram ranks third when it comes to usage frequency, with 65.4 percent of the platform’s Android users opening the Instagram app every day.
Note that this usage frequency data is currently only available for each platform’s Android app, which may skew the findings.
However, data from Statcounter indicates that – at a worldwide level – the Android operating system now runs on almost 74 percent of the world’s connected smartphones, so the good news is that this data is still broadly representative of app users as a whole.
Using social platforms for brand research
If you’re hoping to engage audiences further along the purchase “journey”, it may also be helpful to consider which platforms people rely on when they’re actively researching potential purchases.
For initial perspective, GWI reports that social networks are the second most important channel overall for online brand research after search engines, and they actually rank top amongst audiences aged 16 to 34.
But which individual platforms do people actually use when they’re researching brands on social media?
Well, GWI’s data offers valuable insights here too, but it’s important to note that once again, this particular dataset doesn’t include YouTube.
GWI’s latest survey indicates that Instagram users are the most likely to use that platform for brand research, with 62.8 percent of the platform’s active user base saying that they use Instagram to follow brands or research brands and products.
TikTok ranks second in this dataset, with 56.2 percent, while Facebook ranks third, with 53 percent.
However, it’s worth noting that these figures only reference the share of each platform’s active user base, which means they don’t factor the overall size of the respective platform’s total user base.
And if you’re hoping to reach the greatest absolute number of “social brand researchers”, you may like to know that the ranking would actually be Instagram first, Facebook second, and then TikTok.
Prioritising platforms
The data points we’ve seen so far can help narrow down options to include in your social media mix.
However, none of these data points factor what is potentially the most important consideration: your brand’s available resources.
Crucially, most marketers already find their time and attention spread across too many activities, so one of the easiest ways to improve your chances of success is to focus on “fewer, bigger, better” options.
In other words, don’t try to do too much; choose two – perhaps three – platforms, and focus on getting the most out of those specific opportunities.
And similarly, another important resourcing consideration is budget, i.e. how finances affect both creative production and media spend.
But my advice here is relatively straightforward.
When it comes to creative production, look for synergies; in other words, how easy will it be to reuse assets across the different platforms in your social mix?
And when it comes to media budget, compare “cost per” metrics, such as cost per reach, or – ideally – cost per outcome.
For context, as we saw earlier, platform audience overlaps often mean that you’re reaching largely the same people across most of the top platforms, so if one platform offers a meaningfully cheaper way to deliver your content to them, that platform is probably worth prioritising.
Avoid overcomplication
But overall, my top tip is to avoid “overthinking” things.
As marketing mantras go, I’m a big fan of a minor variation on the tried-and-tested “KISS”: Keep It Super Simple.
As you’ve probably noticed, there’s a huge amount of noise out there, with an endless stream of “gurus”, “experts”, and “influencers” telling marketers to embrace the shiniest new platforms, or to go “all in” on new kinds of content.
But remember when those same individuals were telling you to embrace NFTs and the metaverse?
That advice didn’t age too well, and that’s because – in most cases – “blanket” advice won’t be right for your brand, because there’s no “silver bullet” answer to every marketer’s needs.
So, instead of jumping on every bandwagon and hoping for a miracle, you might want to prioritise:
Clarifying your marketing objectives, by asking yourself, “what does success look like for our brand with this specific activity?”
Identifying the easiest way(s) to deliver those desired outcomes – even if that means doing exactly the same thing as last year.
Keeping track of your results and performance, and being prepared to make changes along the way if needed – even if that means turning a campaign off entirely, and saving your remaining budget for something else.
Hopefully that counsel will help you take a few things off your to-do list for 2026.
That’s all for this analysis, but if you’d like to follow my more regular updates on social media trends, feel free to connect on LinkedIn.
Disclosure: Simon Kemp is a brand ambassador for GWI.
Click here to see all of Simon’s articles, read his bio, and connect with him on social media.